Ticks are collected on an annual basis in the spring, summer and fall to coincide with the presence of different tick stages of development and species. The data provided below, confirmed the presence of tick-borne pathogens at infection rates similar to those found in other New York State counties and in the scientific literature. This program is ongoing and tick collection and analysis will continue into the future. Additional data will be released on an annual basis when available.
Statewide results can be found by visiting https://healthdata.ny.gov/ and then clicking the “All Data” tab.
Results from Suffolk County’s 10 townships can be found at the links below. Data is presented in the form of infection rates. An infection rate is the percentage of ticks positive for a particular pathogen out of the total number of ticks tested, from a collection site. For example, an infection rate of 50% for Borrelia burgdorferi bacteria indicates that 50% of the ticks tested were positive for that pathogen, and the other 50% were negative. Pathogens are typically bacteria, viruses or protozoans, which are capable of causing disease. The table below shows the three species of ticks most likely to bite humans in Suffolk County and their associated pathogens.

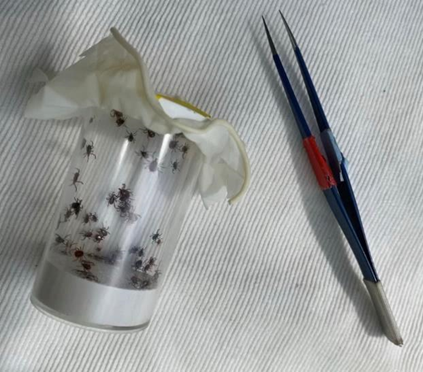
Upper left: Lab staff collecting ticks using a method called flagging. A flag is a common tick collecting tool made from a piece of white fabric attached to a wooden pole. Above: Ticks are removed from the flag and placed into a vial to later be identified, counted, and tested for pathogens.